PAT-M4 | Cross-Cutting Concepts
Grades 6-8
Graphs, charts, and images can be used to identify patterns in data.
NGSS | Cross-Cutting Concepts
Find FREE, ready-to-teach lessons, videos, and more for PAT-M4 (Next Generation Science Standards). Built by scientists, teachers & artists.
PAT-M4 | Cross-Cutting Concepts
Grades 6-8
Graphs, charts, and images can be used to identify patterns in data.
Created with purpose: see how resources connect to this standard.
Showing 4 of 4 units
Fairywrens and the Art of Inquiry: How do scientists pick a question to study?
.png)
Spark your scientific thinking by observing cute Australian bird behavior! Fun, interactive videos feature real biologists and student inquiry & observation. Analyze the scientists' real data to get a window into ongoing research on the evolution of group size in fairywrens.
Alignment summary( Target)
Lesson 2
Students will analyze data to find patterns that support the research question: Is family size in fairywren species determined by the climate of their habitat?
Included resources
2 lessons and 3 supporting media items.
Future Foods: Can we reduce the carbon footprint of our favorite meals?
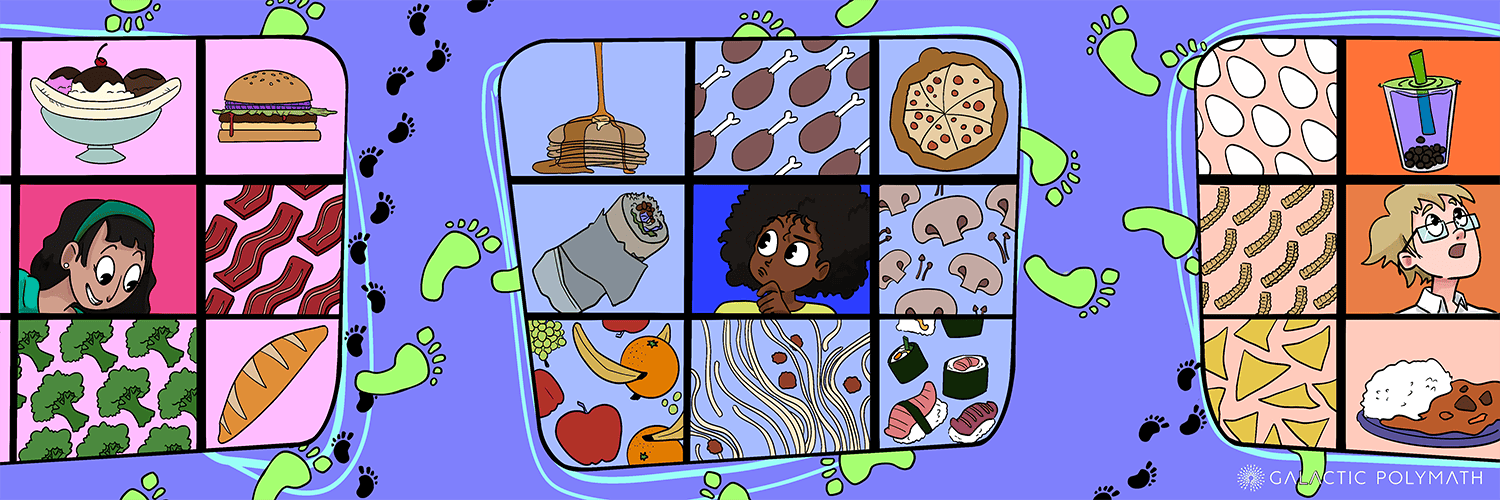
Food and climate are deeply connected. Students will dig into data to discover how our food choices impact greenhouse gas emissions. They will propose solutions to reduce their carbon “foodprint,” both as current consumers and as future food engineers. Students will eat this up in class and savor it for years to come!
Alignment summary( Target)
Lessons: 1, 2
Students will use the PPSTT framework to build data literacy.
Included resources
4 lessons and 4 supporting media items.


Lesson 4
Guardian Frogs of Borneo: Why Exceptions Matter in Biology and Everyday Life
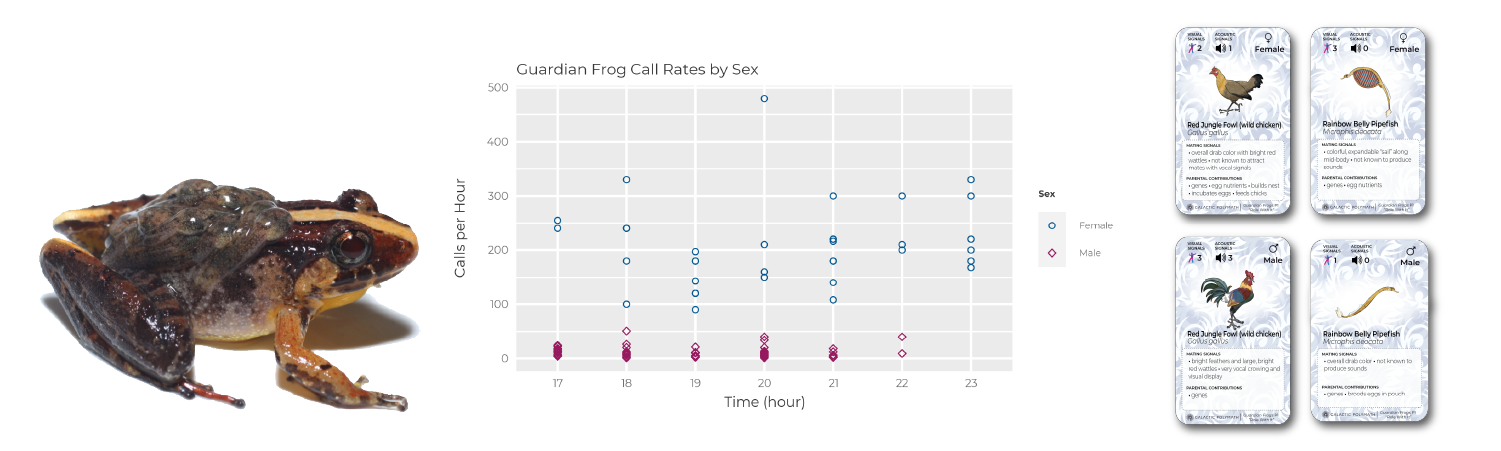
Out of 8,000+ frog species, Guardian Frogs are one of the first to show females that call & males that care for offspring. Students will gain wonder and appreciation for how diverse animal mating systems are while doing fun activities and analyzing real data.
Alignment summary( Target)
Students will practice looking at real data that is variable, and become familiar with looking at mean and variability, through interpreting data represented in tables and scatter plots.
Included resources
3 lessons and 3 supporting media items.
I Like That!: How perception, emotion, and cognition shape our preferences
.png)
Students will conduct experiments and analyze real scientific data as they learn about themselves. They'll learn how our eyes and brains interact to determine what we like and dislike, and apply this knowledge to fish research and the art of character design.
Alignment summary( Target)
Lessons: 1, 2, 3
Included resources
3 lessons and 6 supporting media items.
Lesson 3