HSS-ID.B.6 | Measurement, Data, Probability & Statistics
Grades 9-12
Represent data on two quantitative variables on a scatter plot, and describe how the variables are related.
Math Measurement, Data, Probability & Statistics
Find free, ready-to-teach resources aligned to HSS-ID.B.6. Designed for the Common Core Mathematics set index.
HSS-ID.B.6 | Measurement, Data, Probability & Statistics
Grades 9-12
Represent data on two quantitative variables on a scatter plot, and describe how the variables are related.
Created with purpose: see how resources connect to this standard.
Showing 3 of 3 units
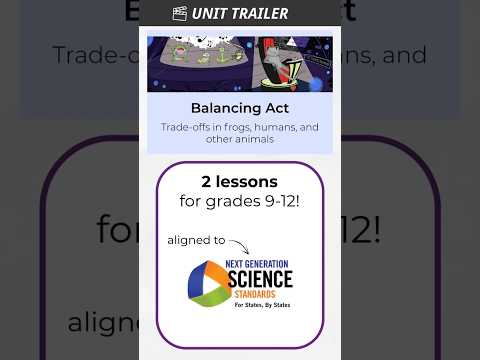
Balancing Act: Tradeoffs in frogs, humans, and other animals
.png)
Students will follow in the soggy footsteps of scientists wading through ponds at night to record frogs as they learn about biological tradeoffs that connect humans to horses to frogs. Along the way, they'll decide which male a female frog should choose as a mate, based on analysis of call performance.
Alignment summary( Connected)
Lesson 1
In Lesson 1, students create scatter plots to show trade-offs and analyze how variables relate in different scenarios. This supports the standard's focus on using scatter plots to represent and analyze data.
Included resources
2 lessons and 4 supporting media items.
.png)
Lesson 1
Supporting videos
.png)
Additional Resources
Supporting videos
Additional Resources
Supporting videos
Females singing to be heard: Challenging long-held assumptions about birdsong through data visualization

Students will learn how data visuals tell a story. They will analyze real bird song data to try to understand why female singing behavior has been overlooked in one of the most common birds in the world. They will also gain a deeper insight into the scientific peer review process.
Alignment summary( Connected)
Included resources
3 lessons and 8 supporting media items.
Lesson 1
Supporting videos
Lesson 2
Supporting videos
Lesson 3
Supporting videos

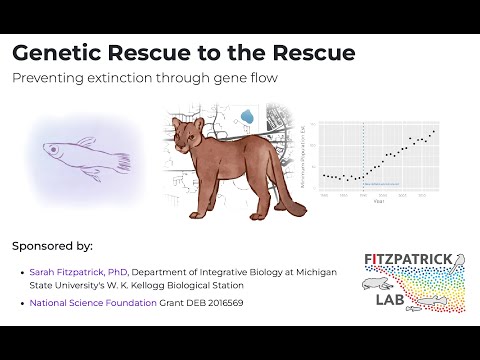
Genetic Rescue to the Rescue: Preventing extinction through gene flow

Students will deepen their understanding of basic genetics concepts as they dive into real data sets from ongoing research. They will hone critical thinking and communication skills and come away with clear examples of how science can lead to positive impacts on wildlife populations.
Alignment summary( Connected)
Lesson 5
Students will interpret population data from Trinidadian guppies and use their findings to explain how it models changes in the Florida Panther population after genetic rescue has occured.
Included resources
5 lessons and 5 supporting media items.
Lesson 2
Lesson 4
Supporting videos